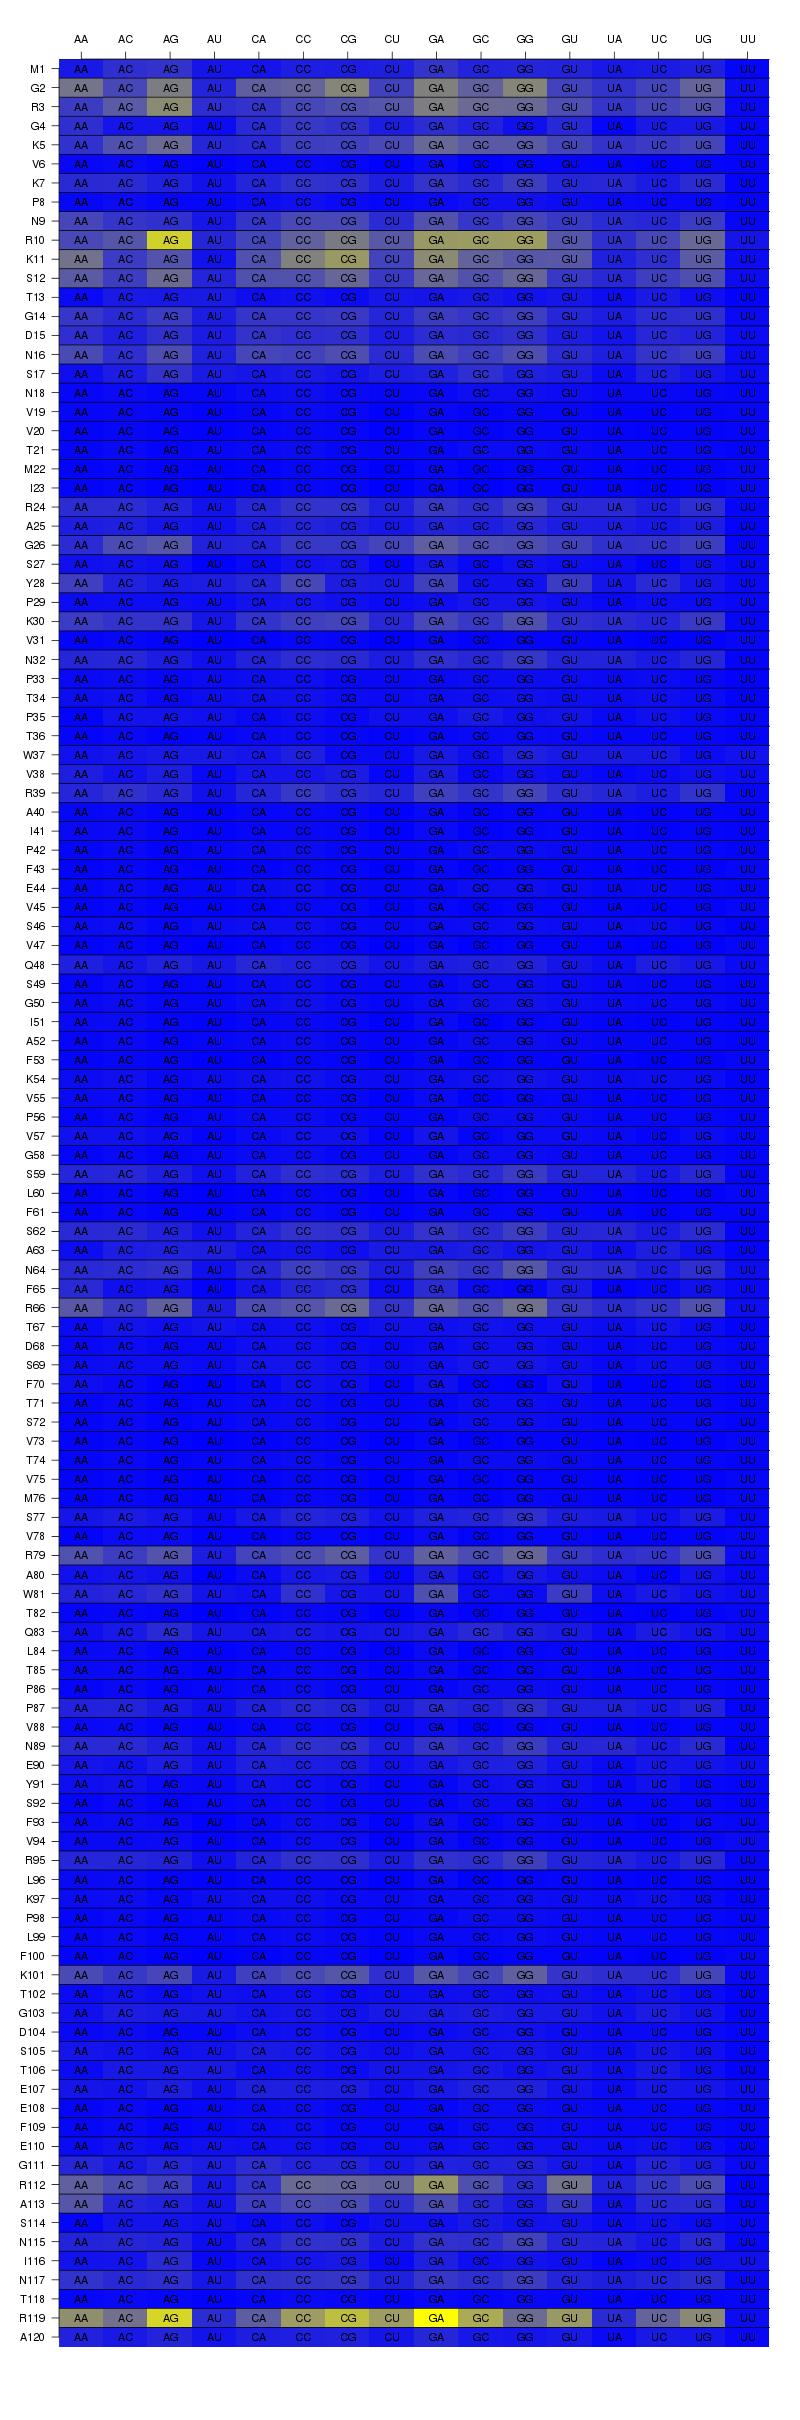
Graphical results are written below:
For complete scores in text/HTML format and alignments used for creating prediction inputs click
HERE
Color scale is from 0 to highest predicted value within the protein. All scores are converted to the expected precision scores at a cutoff equal to the predicted raw scoree (in the training data) and represent predicted probability of contact at that position.
Rows represent amino acid residue and columns denote the dinucleotide.